From FDS to CFAST in about a second: can a zone model predict your FDS results before you run them?
TL;DR
– We built fds2cfast, an in-house converter that turns an ordinary FDS input file into a CFAST 7.7.4 zone-model input — rooms, openings, walls, fire, leakage and fans — with no manual work.
– We tested it on 6 cases (5 with experimental data) and compared experiment, FDS 6.11.1 and CFAST built from the converted file.
– On the upper-layer temperature, CFAST from the converted input had a mean error of 9 % on the temperature rise over 6 measurement locations in 4 tests, against 10 % for FDS and 12 % for NIST’s own hand-made CFAST inputs. The forced-ventilation test (FM/SNL) shows a clear zone-model limit: −52 %; including it, the mean error is 15 % for CFAST and 11 % for FDS.
– Conversion + CFAST take 1–2 seconds; the FDS runs took 35 minutes to 12 hours on 4–8 vCPU (1,800× to 40,000× faster).
– Zone models struggle with interface height in closed rooms, tall shafts and forced supply air. The converter report already flags some of these (geometry outside the validated range, jet momentum not represented); explicit warnings for the others are on the roadmap. This is a proof of concept: the tool is not public yet and will come to cloudHPC as a pre-check for FDS jobs.
Why convert FDS to CFAST?
FDS is one of the most used solvers on cloudHPC. Before launching a model that may run for hours or days, every engineer asks the same questions: is my set-up sane? How hot will it get? Will the smoke layer come down? Is this worth a full run?
CFAST (Consolidated Model of Fire and Smoke Transport, NIST) answers these questions for a multi-room building in about a second, because it splits each room into two well-mixed zones instead of solving millions of cells. The catch is that nobody wants to build a second model by hand. NIST itself writes separate inputs for FDS and CFAST in its validation suites.
So we asked a simple question: can the FDS input file itself be turned into a CFAST model automatically, and how close does the result get?
Results at a glance
Mean upper-layer temperature over the steady part of each test, and error on the temperature rise against the experiment.
| Case | Location | Experiment | FDS 6.11.1 | CFAST, fds2cfast input | CFAST, NIST hand-made input |
| Steckler Test 14 | room, steady state | 119 °C | 122 °C (+3 %) | 133 °C (+15 %) | 121 °C (+2 %) |
| NBS Multi-Room 100A | fire room, 600–900 s | 268 °C | 296 °C (+12 %) | 261 °C (−3 %) | 249 °C (−8 %) |
| NBS Multi-Room 100A | corridor, 600–900 s | 106 °C | 102 °C (−5 %) | 110 °C (+5 %) | 114 °C (+10 %) |
| ATF Corridors 240 kW | lower corridor (fire), 300–880 s | 169 °C | 170 °C (0 %) | 154 °C (−10 %) | 141 °C (−20 %) |
| ATF Corridors 240 kW | upper corridor, 300–880 s | 83 °C | 73 °C (−17 %) | 73 °C (−17 %) | 72 °C (−19 %) |
| NIST/NRC Test 1 | hall, 600–1200 s | 126 °C | 150 °C (+23 %) | 120 °C (−5 %) | 112 °C (−13 %) |
| FM/SNL Test 1 | room, 300–580 s | 66 °C | 59 °C (−15 %) | 42 °C (−52 %) | not available |
| Staircase 12.24 m | shaft, 300–600 s (no experiment) | — | 60 °C (height average) | 81 °C (one mixed zone) | — |
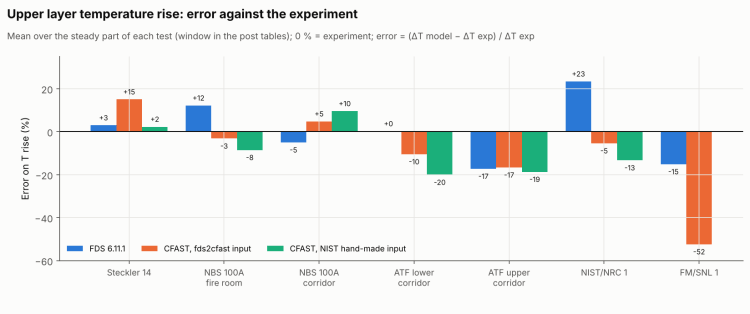
Mean absolute error on the temperature rise (same 6 locations in 4 tests, FM/SNL excluded because there is no NIST CFAST input for it): CFAST from fds2cfast 9.3 %, FDS 10.2 %, CFAST from NIST’s hand-made inputs 12.1 %. Including FM/SNL: CFAST from fds2cfast 15.4 %, FDS 10.9 %. The 9 vs 10 % gap is small and mostly due to one test (NIST/NRC, where FDS runs 23 % hot): read it as “comparable”, not “better”.
Temperature is only half of the story. FDS predicts the smoke-layer height much better: within 0.4 m of the experiment everywhere except FM/SNL (−0.8 m). CFAST puts the interface up to 0.6 m too high in rooms and corridors (0.0 m off in the NBS corridor), lets it reach the floor in the closed NIST/NRC hall (experiment: 1.2 m), and gets FM/SNL wrong by 3.6 m. NIST’s hand-made inputs show the same trend in Steckler, ATF and NIST/NRC, so this is mostly the zone model; in the NBS fire room NIST’s input is exact while the converted one is 0.3 m high (the L-shaped room becomes a box).
How the runs were set up
- FDS 6.11.1 on cloudHPC, spot (preemptible) hypercore instances, one MPI process per mesh (4–8 vCPU). FDS validation inputs from the FDS repository (the staircase is a user model);
MULTmeshes expanded and large meshes split so that every mesh gets its own process. - CFAST 7.7.4 built from source; run on one core.
- Experimental data from the
firemodels/exprepository. FDS layer heights and temperatures come from thermocouple trees reduced with the same method used for the experiments (Janssens–Tran / FDS layer reduction). - NIST’s CFAST inputs from the CFAST validation suite, where available (Steckler, NBS, ATF, NIST/NRC), as an independent reference.
Case 1 — Steckler Test 14: one room, one door

A 2.8 × 2.8 × 2.13 m room with a 62.9 kW methane burner and a 0.74 × 1.83 m door. The converted CFAST input runs 15 % hot on the temperature rise; NIST’s hand-made input is within 2 %. Most of the difference is in the input data, not in the conversion: the FDS validation input uses a wall conductivity k = 0.1 W/m/K, the NIST CFAST input k = 1 W/m/K, and NIST also uses a radiative fraction of 0.20 instead of 0.35. With k = 1 alone the converted input gives 116 °C; with NIST’s k and radiative fraction it gives 122 °C, against 121 °C for NIST’s input.

What we learned: the converter copies the FDS input faithfully, including its assumptions. A difference between FDS and CFAST is often a difference in input data, not in the model.
Case 2 — NBS Multi-Room 100A: fire room and corridor

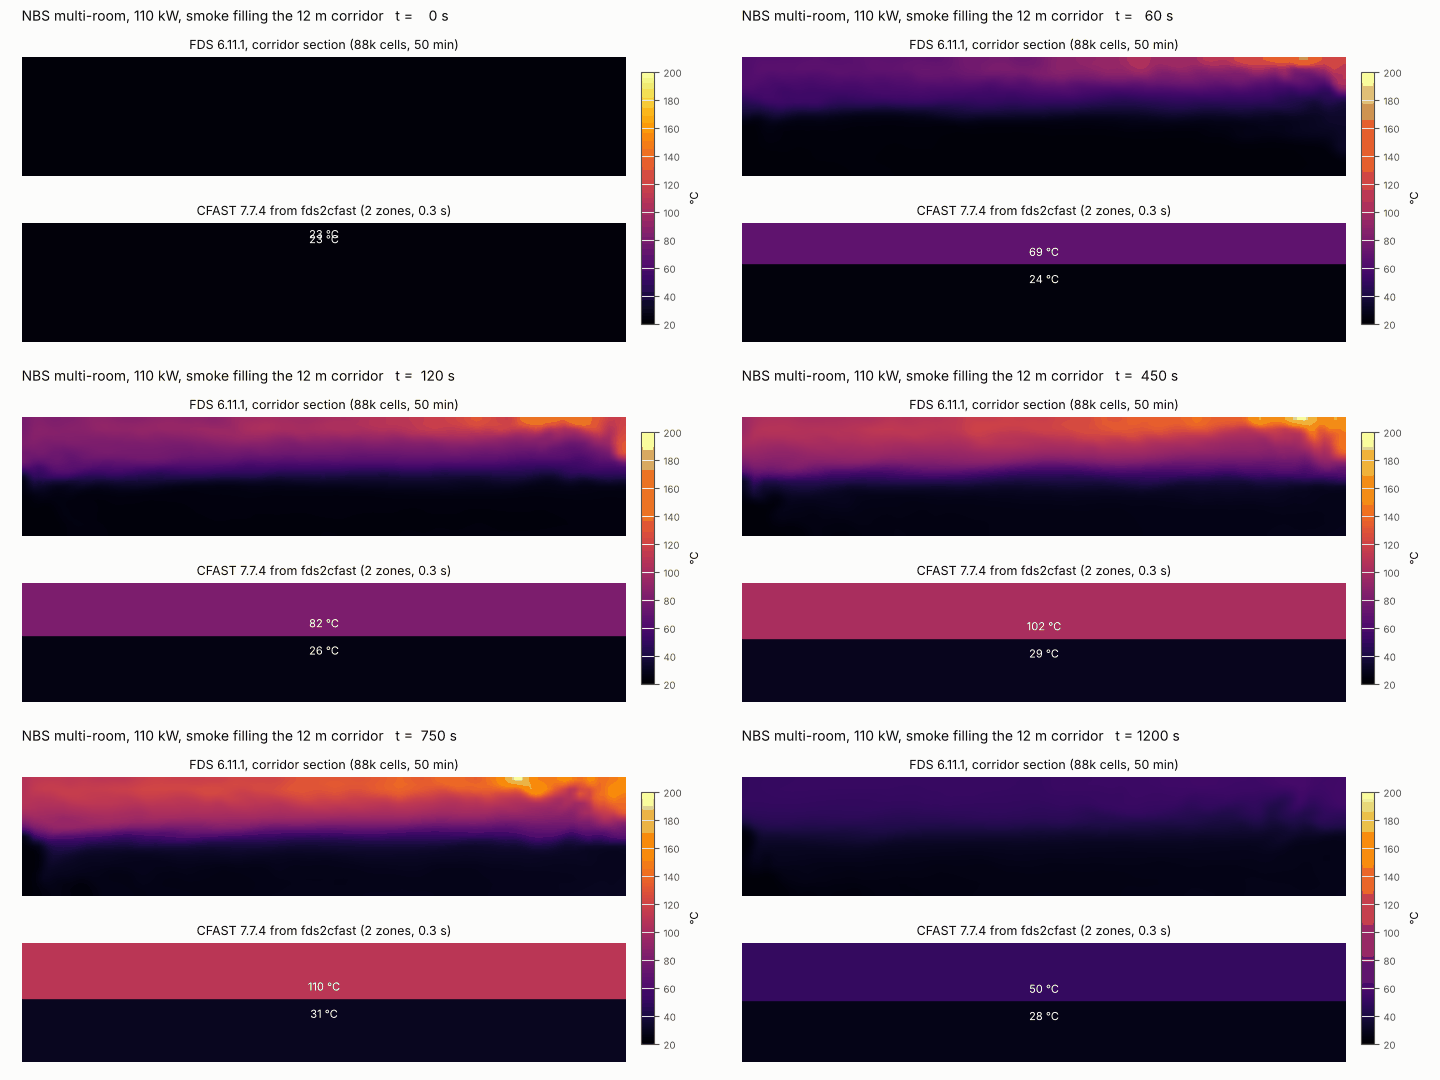
A 110 kW burner in a fire room connected to a 12 m corridor. The FDS file has no HOLE for the doorway: the door is a gap between obstructions. fds2cfast finds it as a narrow cross-section (24 % of the rooms on either side) and turns it into a wall vent. CFAST is within −3 % in the fire room and +5 % in the corridor; FDS is +12 % and −5 %.

What we learned: on temperature, CFAST from the converted file is as good as the hand-made NIST input or better; on the fire-room layer height NIST’s input is better (0.0 vs +0.3 m), because the L-shaped fire room (fill ratio 0.81) becomes a box.
Cases 3–6 — corridors on two floors, forced ventilation, a closed hall and a staircase

ATF Corridors 240 kW
Two 14.3 m corridors on two floors joined by a stairwell, with the upper corridor open at the far end. fds2cfast v0.1 merged everything into one room; v0.2 splits the space along the FDS mesh layout into stairwell + two corridors. In the fire corridor CFAST is −10 %, closer to the experiment than NIST’s own input (−20 %); FDS is almost exact. In the upper corridor all three models are 17–19 % low.

NIST/NRC Test 1
A 412 kW heptane spray fire in a closed 21.7 × 7.0 × 3.8 m hall with leakage only. CFAST from the converted file is within −5 % on the temperature rise (peak 140 vs 144 °C); FDS runs +23 % hot (its burning rate is about 2 % higher than the prescribed 412 kW, a small part of that). Oxygen at 3.22 m is within 0.8 percentage points for all models. But with no openings the CFAST layer fills the hall down to the floor, while FDS and the experiment keep it around 1 m.

FM/SNL Test 1 — where the zone model breaks
A 516 kW fire in an 18.2 × 12.2 × 6.1 m room with six supply ducts (3.8 m³/s) ending at 4.9 m and blowing down onto deflector plates at 4.6 m, and an exhaust opening in the ceiling. CFAST puts the cold supply air into the hot layer at duct height, which dilutes and thickens it: −52 % on the temperature rise and an interface at 1.1 m instead of 4.7 m. In a quick test with the supply placed at 0.5 m, CFAST gives 52 °C (−32 % on the rise) and 3.7 m: much closer on layer height to FDS (3.9 m) and the experiment (4.7 m), still too cold (FDS 59 °C, experiment 66 °C).

A 12 m staircase (no experiment)
A 120 kW propane fire at the bottom of a 4.2 × 2.4 × 12.24 m stair shaft, open only at the top. FDS shows no two-layer structure: the gas is hottest near the fire (about 105 °C between 1.5 and 3 m) and cools to about 35 °C at the top, because the cold walls and stairs take the heat out. CFAST can only see one well-mixed zone at 81 °C, against a height-averaged 60 °C in FDS (both averaged over 300–600 s). Oxygen agrees: at 600 s the FDS average of the 7 probes (16.3 %, range 14.4–17.4 % over the height) equals the CFAST value (16.3 %).

This case also caught a bug. In v0.1 the FDS INERT walls became adiabatic in CFAST, and the shaft reached 965 °C at 600 s. With v0.2 (cold walls) it is 80 °C.
What we learned from cases 3–6: CFAST built from the FDS file gives credible temperatures and oxygen for rooms and corridors, as good as the hand-made inputs or better in these tests. It is not reliable for interface height in closed rooms, for tall shafts, or with strong forced supply air. Today the report flags only part of this (the staircase geometry is outside the validated range; jet momentum is not represented): explicit warnings for tall shafts, closed rooms and forced supply are the next upgrade.
What didn’t work (yet)
- One room for corridors + stairwell (ATF, v0.1): fixed with the mesh-based split.
- Adiabatic walls for FDS
INERTsurfaces (staircase, v0.1): 965 °C instead of 80 °C; fixed. - Supply ducts on obstruction faces not detected (FM/SNL, v0.1): fixed, but the supply air still goes into the wrong layer.
- Not converted yet:
&HVACnetworks, jet fans,&GEOMgeometry, doors opened by devices (converted as always open), wind.
The open items are on the converter roadmap: stacked compartments for stairwells, cold supply air in the lower layer, HVAC networks and device-controlled doors.
Run times and costs
| Case | FDS meshes / vCPU | FDS wall time | FDS cost on cloudHPC | fds2cfast + CFAST |
| Steckler 14 | 8 / 8 | 1.0 h | earlier run | 2.1 s |
| NBS 100A | 5 / 8 | 50 min | €0.85 | 0.9 s |
| ATF Corridors 240 kW | 8 / 8 | 2.8 h | €2.60 | 1.1 s |
| FM/SNL Test 1 | 5 / 8 | 3.2 h | €2.95 | 0.8 s |
| NIST/NRC Test 1 | 8 / 8 | 12.3 h (two jobs: stopped at 190 s and resumed) | €11.11 (two jobs) | 1.1 s |
| Staircase | 4 / 4 | 35 min | €0.32 | 1.1 s |

All FDS runs used spot instances; FDS restarts automatically from its restart files if an instance is pre-empted. The NIST/NRC run was stopped by us at 190 s to change the end time, then resumed from its restart files. CFAST times are for a debug build (−O0) on one core.
How you will use it on cloudHPC
fds2cfast is not released publicly. It is calibrated and tested on our own FDS data, and that is what makes it reliable. It will come to cloudHPC as a pre-check for FDS jobs: upload your FDS case as usual and get, in seconds,
- the CFAST prediction of temperatures, smoke layer, visibility and oxygen per room, as graphs and an animation;
- the converter report: what was converted, what was assumed and where the zone model is outside its validated range.
Meanwhile, if you run FDS on cloudHPC: use one mesh per MPI process (expand MULT meshes), add DT_RESTART so spot runs can restart, and download your results within 60 days.
FAQ
Can CFAST replace FDS?
No. CFAST is a quick check: in our tests it was close to FDS and the experiments on upper-layer temperature for rooms and corridors, but it cannot resolve local effects, tall shafts or strong forced ventilation, and its layer height is less reliable. Use it to screen designs and catch errors before running FDS.
How accurate is CFAST compared with FDS?
On 6 measured locations in 4 tests, the mean error on the upper-layer temperature rise was 9 % for CFAST from fds2cfast and 10 % for FDS: comparable. Including the forced-ventilation test it is 15 % vs 11 %. FDS is clearly better on smoke-layer height and with forced ventilation.
How much faster is CFAST than FDS?
Conversion plus a CFAST run took 1–2 seconds in every case, against 35 minutes to 12 hours for FDS on 4–8 vCPU: 1,800 to 40,000 times faster.
Which FDS features cannot be converted to a zone model?
HVAC duct networks, jet fans and other momentum-driven flows, &GEOM geometry, pyrolysis models (the HRR must be prescribed), wind, and detailed local quantities such as devices near the plume.
Is fds2cfast available?
Not yet. It will be offered on cloudHPC as a pre-check for FDS jobs. Contact us if you want to try it on your own cases.
References
- Peacock R.D., McGrattan K.B., Forney G.P., Reneke P.A., CFAST – Consolidated Fire and Smoke Transport (Version 7): Technical Reference Guide, NIST Technical Note 1889v1. https://doi.org/10.6028/NIST.TN.1889v1
- Peacock R.D. et al., CFAST – Consolidated Fire and Smoke Transport (Version 7): Software Development and Model Evaluation Guide, NIST Technical Note 1889v3. https://doi.org/10.6028/NIST.TN.1889v3
- McGrattan K. et al., Fire Dynamics Simulator User’s Guide and Validation Guide, NIST Special Publication 1019 and 1018-3. https://pages.nist.gov/fds-smv/
- Steckler K.D., Quintiere J.G., Rinkinen W.J., Flow Induced by Fire in a Compartment, NBSIR 82-2520, National Bureau of Standards, 1982.
- Peacock R.D., Davis S., Babrauskas V., Data for Room Fire Model Comparisons, Journal of Research of NIST 96(4):411–462, 1991. https://doi.org/10.6028/jres.096.024
- Hamins A. et al., Report of Experimental Results for the International Fire Model Benchmarking and Validation Exercise #3, NUREG/CR-6905, NIST SP 1013-1, 2006.
- Nowlen S.P., Enclosure Environment Characterization Testing for the Base Line Validation of Computer Fire Simulation Codes, NUREG/CR-4681, SAND86-1296, Sandia National Laboratories, 1987.
- ATF Corridors experiments: description and data in the FDS Validation Guide and in
firemodels/exp(ATF_Corridors). - Janssens M., Tran H.C., Data Reduction of Room Tests for Zone Model Validation, Journal of Fire Sciences 10(6):528–555, 1992.
- Experimental data and validation inputs: https://github.com/firemodels/exp, https://github.com/firemodels/fds, https://github.com/firemodels/cfast
CloudHPC is a HPC provider to run engineering simulations on the cloud. CloudHPC provides from 1 to 224 vCPUs for each process in several configuration of HPC infrastructure - both multi-thread and multi-core. Current software ranges includes several CAE, CFD, FEA, FEM software among which OpenFOAM, FDS, Blender and several others.
New users benefit of a FREE trial of 300 vCPU/Hours to be used on the platform in order to test the platform, all each features and verify if it is suitable for their needs