Sprinklers in FDS: 4 ways to model the HRR curve, tested on cloudHPC
TL;DR
- We ran one car-park fire in FDS 6.11.1 five ways: with no sprinklers, and with four common ways to account for them. The four are: freeze the HRR at first activation; freeze it and add the water spray; freeze it and apply an exponential decay; and let water suppress the fire through
E_COEFFICIENT.- All four sprinkler variants apply the sprinkler effect correctly. Between 1100 and 1200 s, the HRR FDS actually computed is within 1 % of the intended curve: 390 kW when frozen (388.5 kW intended), 59 kW with the decay (58.6 kW intended).
E_COEFFICIENTcut the car fire by over 90 % within 30 s and put it out in about a minute. A real car is shielded, so treat that as a warning, not a result.- Activation times are the input every one of these methods depends on. Against the Bittern room tests, FDS 6.11.1 predicted 38 of 41 activations, with a mean error of +10.5 %; 33 of the 38 were within ±20 %.
- On the UL/NFPRF plastic-commodity rack tests,
E_COEFFICIENToverpredicts the number of open heads by 3–5×. FDS opened 24 heads against 5 in the test (P-4), and 27 against 7 (P-5). NIST’s own runs of the current FDS show the same: 26 and 22.- Cost on cloudHPC for the 1.34 M-cell car park, 1200 s, 16 vCPU spot: €6.01 (decay) to €15.38 (no sprinklers). Adding the water spray costs +34 % wall time. Scaling from 8 to 96 meshes cut the solver time by 11×.

Temperature on the longitudinal section through the burning car (y = 2.6 m) for four of the five variants, with the HRR that FDS computed (log scale). FDS 6.11.1, 1.34 M cells, cloudHPC 16 vCPU hypercore spot.
Why this question keeps coming back
Almost every fire-engineering report for a sprinklered building contains the same sentence: “the effect of the sprinklers was taken into account by…”. What follows varies a lot. Some engineers cut the design curve when the first head opens. Some add the water spray to the model. Some apply a decay. Some let FDS put the fire out with E_COEFFICIENT. On forums the question comes up every few months, and the answers often copy an exponential-decay constant that is wrong by a factor of 10 (see the pitfalls box).
So we asked two practical questions.
- Does the HRR curve you get from FDS match what you meant to put in? We checked the HRR as computed by the solver, not the
RAMPyou wrote. - What does each option cost, in accuracy and in run time on cloudHPC?
To answer them we used three cases:
- Car park: five modelling variants of one design fire. This is where we compare the methods.
- Bittern room tests (21 tests, 41 sprinkler activations): do we get the activation time right? Every method in this post starts from it.
- UL/NFPRF plastic commodity tests P-4 and P-5: the only suppression-validation case for
E_COEFFICIENTin the FDS Validation Guide.
Results at a glance
| Variant | What it does in FDS | 1st activation [s] | Heads open at 1200 s | HRR 1100–1200 s: FDS / intended [kW] | Wall time | Cost |
|---|---|---|---|---|---|---|
| FREE | t² design curve, sprinklers only detect | 330 | 50 (all) | 4813 / 4823 | 8.6 h | €15.38 |
| CAP | curve frozen at first activation (NO_UPDATE_CTRL_ID) |
328 | 2 | 390 / 388.5 | 4.6 h | €8.34 |
| CAPWET | CAP + water spray (Lagrangian particles) | 326 | 2 | 387 / 384.5 | 6.2 h | €11.15 |
| DECAY | CAP + exponential decay, k = 0.0023 s⁻¹ (Madrzykowski & Vettori) | 328 | 1 | 59 / 58.6 | 3.3 h | €6.01 |
| ECOEF | t² curve + water + E_COEFFICIENT=0.5 |
330 | 1 | 0 / (physics decides) | 5.0 h | €8.97 |
Car park 30 × 16 × 2.8 m, 0.1 m cells, 16 meshes, FDS 6.11.1, cloudHPC 16 vCPU hypercore spot. “Intended” is the design curve evaluated at the activation time FDS found in that run. Times are rounded to the 2 s device output.
The car park: how the runs were set up

- Solver: FDS 6.11.1 (cloudHPC solver
fds6.11.1), one MPI process per mesh. - Domain: 30 × 16 × 2.8 m with 0.1 m cells, giving 1.34 M cells in 16 meshes of 75 × 40 × 28. The two short ends are open: the model is a slice of a larger car park. There are two rows of 12 parked cars, modelled as steel boxes 1.9 × 4.4 × 1.4 m, with a 6.4 m aisle between them.
- Design fire: a t² curve reaching 8.2 MW at 25 min, from CTICM car test C2 (Joyeux 1997, collected by Tohir & Spearpoint 2013). It is released on the top face of one car: 1.9 × 4.4 m,
HRRPUA = 980.86 kW/m², ramp points every 30 s. Fuel is a propane surrogate with soot yield 0.07 and CO yield 0.04. - Sprinklers: 50 pendent heads on a 3 × 3 m grid at 2.7 m: 68 °C, RTI 100 (m·s)^½, C-factor 0.7. Each discharges 45 L/min (5 mm/min over 9 m²) of 1 mm drops in the wet variants.
- Freeze trigger: the curve freezes when any of the 10 heads around the burning car opens (
CTRL FUNCTION_TYPE='ANY'). - Outputs: the instantaneous HRR (
DEVC QUANTITY='HRR'withTEMPORAL_STATISTIC='INSTANT VALUE'). Tenability points at 1.8 m height, on the aisle centreline at 0, ±4, ±8 and ±12 m along x from the burning car, record temperature, extinction coefficient and CO. The variants with water also record the water mass on the burning face.
The five variants and their .fds settings
Every snippet below is copied from the input files we ran; the full inputs and the analysis scripts are in the cases ZIP. Lines common to all variants are shown once.
Common to all variants: the t² curve and the sprinkler heads
&SURF ID='CAR FIRE', HRRPUA=980.86, RAMP_Q='CAR', COLOR='RED' /
&RAMP ID='CAR', T=0.0,    F=0.000000 /
&RAMP ID='CAR', T=30.0,   F=0.000400 /
...                                    ! F = (T/1500)^2 every 30 s
&RAMP ID='CAR', T=1500.0, F=1.000000 /  ! last point = peak; NO far point like T=1E5
&PROP ID='SPRINKLER', QUANTITY='SPRINKLER LINK TEMPERATURE', ACTIVATION_TEMPERATURE=68.0,
      RTI=100., C_FACTOR=0.7, SMOKEVIEW_ID='sprinkler_pendent' /   ! FREE/CAP/DECAY: detection only
&DEVC ID='SPR_105', PROP_ID='SPRINKLER', XYZ=13.50,1.50,2.70 /     ! ... 50 heads
&DEVC ID='HRR', QUANTITY='HRR', XB=0,30,0,16,0,2.8, TEMPORAL_STATISTIC='INSTANT VALUE' /
FREE: no sprinkler effect
This is the t² curve above with nothing else. The heads only detect, so we know when they would have opened.
CAP: freeze the curve at first activation
The RAMP uses a frozen clock instead of the simulation time. FROZEN TIME follows the time until FIRST ACTIVATION becomes true, then NO_UPDATE_CTRL_ID stops it updating:
&RAMP ID='CAR', T=0.0, F=0.000000, DEVC_ID='FROZEN TIME' /   ! only the first RAMP line changes
&CTRL ID='FIRST ACTIVATION', FUNCTION_TYPE='ANY',
      INPUT_ID='SPR_104','SPR_105','SPR_106','SPR_107','SPR_204','SPR_205','SPR_206',
               'SPR_304','SPR_305','SPR_306' /
&DEVC ID='TIMER',       XYZ=0.5,8.0,0.5, QUANTITY='TIME' /
&DEVC ID='FROZEN TIME', XYZ=0.5,8.0,0.5, QUANTITY='TIME', NO_UPDATE_CTRL_ID='FIRST ACTIVATION' /
CAPWET: frozen curve plus water spray
This is CAP plus real water drops, so the spray cools the gas, drags the smoke down and makes steam. The HRR stays frozen:
&SPEC ID='WATER VAPOR' /                                  ! required, or FDS stops at start
&PART ID='WATER DROPS', DIAMETER=1000., MONODISPERSE=.FALSE., SPEC_ID='WATER VAPOR',
      SAMPLING_FACTOR=10, COLOR='BLUE' /
&PROP ID='SPRINKLER', QUANTITY='SPRINKLER LINK TEMPERATURE', ACTIVATION_TEMPERATURE=68.0,
      RTI=100., C_FACTOR=0.7, PART_ID='WATER DROPS', FLOW_RATE=45., PARTICLE_VELOCITY=6.,
      SPRAY_ANGLE=0.,75., SMOKEVIEW_ID='sprinkler_pendent' /
&DEVC ID='WATER ON CAR', QUANTITY='MPUA', PART_ID='WATER DROPS',
      XB=12.8,14.7,0.4,4.8,1.4,1.4, IOR=3, SPATIAL_STATISTIC='SURFACE INTEGRAL' /
DECAY: exponential decay after activation
This one builds Q(t) = Q(t_act) · e^(−k (t − t_act)) with control functions, in a single run. The RAMP that feeds the SURF reads its value from a control function (CTRL_ID_DEP). The t² table moves to a second ramp, GROWTH, read with the frozen clock:
&RAMP ID='CAR', T=0., F=0., CTRL_ID_DEP='Q_FRACTION' /       ! SURF value = output of Q_FRACTION
&RAMP ID='GROWTH', T=0.0, F=0.000000 /  ...  &RAMP ID='GROWTH', T=1500.0, F=1.000000 /
&CTRL ID='Q_GROWTH',    FUNCTION_TYPE='CUSTOM',   INPUT_ID='FROZEN TIME', RAMP_ID='GROWTH' /
&CTRL ID='T_SINCE_ACT', FUNCTION_TYPE='SUBTRACT', INPUT_ID='TIMER','FROZEN TIME' /
&CTRL ID='DECAY ARG',   FUNCTION_TYPE='MULTIPLY', INPUT_ID='T_SINCE_ACT','CONSTANT', CONSTANT=-0.0023 /
&CTRL ID='DECAY',       FUNCTION_TYPE='EXP',      INPUT_ID='DECAY ARG' /
&CTRL ID='Q_FRACTION',  FUNCTION_TYPE='MULTIPLY', INPUT_ID='Q_GROWTH','DECAY' /
FIRST ACTIVATION, TIMER and FROZEN TIME are the same as in CAP. Before activation T_SINCE_ACT is 0, so the curve is the plain t². The constant k = 0.0023 s⁻¹ is from Madrzykowski & Vettori (NISTIR 4833, 1992). The report calls it an upper bound for light-hazard office furnishings that are not heavily shielded, at a spray density of at least 0.07 mm/s. A car does not really fit that description; we use it here because it is what people use.
ECOEF: let the water suppress the fire
This variant uses the plain t² curve (no freeze), the same water spray as CAPWET, and one extra parameter on the burning surface:
&SURF ID='CAR FIRE', HRRPUA=980.86, RAMP_Q='CAR', COLOR='RED', E_COEFFICIENT=0.5 /FDS then multiplies the burning rate by e^(−∫k dt), with k = E_COEFFICIENT × water mass per unit area on that surface (FDS User’s Guide, “Suppression by Water”, subsection “Reduction of the Burning Rate”). E_COEFFICIENT has to come from experiments. 0.5 m²/(kg·s) is the value in the FDS UL/NFPRF validation inputs, measured for cartoned plastic commodity, not for cars.
Car park results: the HRR FDS actually used

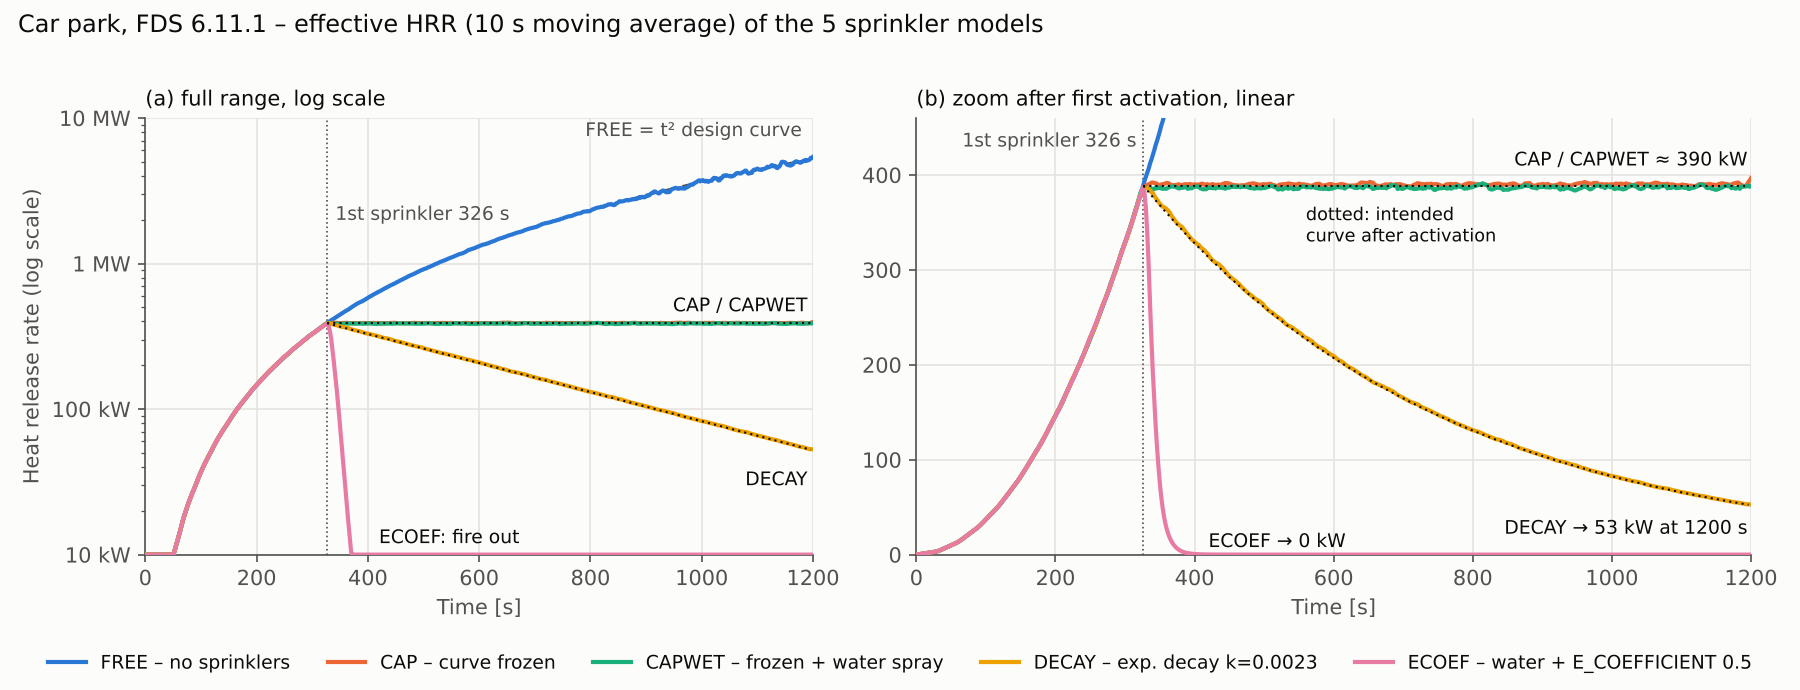
- The frozen curve stays frozen. The first head opened at about 326–329 s, depending on the variant. At that time the t² curve is at about 388 kW. CAP holds 390 kW to the end and CAPWET holds 387 kW. Both are within 1 % of the intended value, with water on the car or without it.
- The single-run decay works. DECAY falls from 388 kW to 53 kW at 1200 s. The 1100–1200 s average is 58.9 kW against 58.6 kW from the formula. You do not need to post-process the curve and run the case a second time.
E_COEFFICIENTput the fire out. From 393 kW at the first activation (328 s), the HRR is down to 26 kW 30 s later, below 1 kW after about 70 s, and zero from about 450 s. The spray lands directly on the burning face: 4.8 kg of water on 8.36 m² by 400 s, about 0.6 kg/m². Once the water has built up, that gives k ≈ 0.3 s⁻¹ in the model, a time constant of about 3 s. A real car fire burns largely inside the cabin and under the body, where the spray does not reach. This variant is the most “physical” of the five, and here it gives the least conservative answer.- FREE follows the t² curve: 4813 kW against 4823 kW averaged over the last 100 s. All 50 heads would have opened by 1102 s.
- Number of open heads: 1–2 in every sprinklered variant. In CAP, the second head opened only at 870 s, under the hot layer of a 390 kW fire.
Tenability at 1.8 m
| Variant | Max temperature [°C] | Min visibility [m] | Max CO [ppm] |
|---|---|---|---|
| FREE | 35.7 | 11.1 | 16 |
| CAP | 22.3 | 27.3 | 6 |
| CAPWET | 22.5 | 29.0 | 6 |
| DECAY | 21.9 | 30 (cap) | 5 |
| ECOEF | 21.1 | 30 (cap) | 4 |
Worst value over the seven points at 1.8 m on the aisle centreline (0, ±4, ±8, ±12 m along x from the burning car). Visibility from 3/K (light-reflecting sign), capped at 30 m.
The domain is open at both ends, so smoke leaves. Even the free-burning case stays just above the usual 10 m visibility criterion at 1.8 m for 20 minutes (11.1 m at worst). With a ~390 kW fire, the four sprinkler models are all far from the limits. The choice of model starts to matter when the result is a structural load, or when the car park is closed and smoke builds up.
What we learned on the car park
- In FDS 6.11.1, CAP and DECAY reproduce the intended curve within 1 %, provided the
RAMPis written correctly (see the pitfalls box). The only uncertainty left is when the first head opens. - Adding the water spray (CAPWET) changed almost nothing here for HRR or tenability, but it cost 34 % more wall time. It is worth the price when spray cooling or smoke drag-down is the question.
E_COEFFICIENTwithout a fuel-specific coefficient and without shielding is not a design method. It can extinguish a fire that real sprinklers would only control.
Is the activation time right? The Bittern room tests

Every method above starts from the time of first activation. We therefore ran the Bittern tests: 22 chair fires in an 8 × 4 × 2.4 m plasterboard room with two heads, from the University of Canterbury, 2004. The inputs and the measured HRR curves are the ones in the FDS Validation Guide. Test 11 is excluded there (failed mass-loss measurement), and in test 20 only one head has a measured time, so there are 41 activations in all.

- 38 of 41 activations predicted before the end of the run.
- Mean error +10.5 %, mean absolute error 11.0 %, 33 of the 38 within ±20 % (median +6.2 %). FDS is late in 31 of the 38, which is the non-conservative direction for a design that freezes the fire at first activation.
- Outliers: test 16 (+63 % and +76 %), test 20 (+35 %), test 1 head 1 (+28 %) and test 14 head 1 (+22 %).
- Missed: three heads did not open before the end of the run (test 8 head 1, tests 21 and 22 head 2). All three are late by at least 27 %, so the mean above understates the late bias.
- Takeaway: a ±20 % error on the activation time changes the frozen HRR of a t² fire by +44 % / −36 %, because HRR goes with t². Do a sensitivity run on the activation time, or on the RTI, before you trust a frozen curve.
Does E_COEFFICIENT get the sprinkler count right? UL/NFPRF P-4 and P-5

The UL/NFPRF rack tests (McGrattan, Hamins & Stroup, NISTIR 6196-1, 1998) are the reference for E_COEFFICIENT in the FDS Validation Guide. The setup is a 30.5 m square test hall with an 8.2 m ceiling, 100 K-11 heads on a 3.05 m grid, draft curtains, and four-tier racks of Group A cartoned plastic. We ran P-4 and P-5 from the official inputs: MULT expanded into 16 explicit meshes of 50 × 50 × 60 (15 cm, 2.4 M cells). We stopped the runs at about 300 s: P-4 at 352 s, well after its last experimental activation (200 s); P-5 at 296 s, just before its 7th head at 304 s, by which time FDS already had 27 open. We also ran P-4 a second time with E_COEFFICIENT=0, that is, water spray with no suppression.

| Test | Experiment: heads (last at) | FDS 6.11.1 on cloudHPC, E = 0.5 | NIST run, FDS 6.11.1-154 (firemodels/out) | FDS on cloudHPC, E = 0 |
|---|---|---|---|---|
| P-4 | 5 (200 s) | 24 by 190 s (run to 350 s) | 26 | 58 by 290 s, HRR 45 MW |
| P-5 | 7 (304 s) | 27 by 200 s (run to ~300 s) | 22 | – |
- The first head opens late: about 108 s in FDS against 93 s (P-4, +16 %) and 74 s (P-5, +46 %) in the tests.
- FDS then opens 3–5 times too many heads. This is not a problem with our setup. NIST’s current runs of the same inputs give the same picture: 26 heads in P-4 and 22 in P-5.
E_COEFFICIENTdoes suppress the fire, but not fast enough. The water starts holding the fire back at about 120 s, with 2–4 heads open. With E = 0.5 the P-4 HRR still peaks at 12 MW at 170 s, with 19 heads open, and falls to 0.7 MW by 290 s. With E = 0 it reaches 45 MW and 58 heads open. In the test, the fire was controlled with 5.- Takeaway: use
E_COEFFICIENTto compare options in a study with a calibrated coefficient, not to claim a sprinkler count or a design HRR.
Pros and cons, side by side
| Method | Accuracy / defensibility | Run time (car park, vs CAP) | Use it when | Watch out for |
|---|---|---|---|---|
| FREE (no sprinklers) | Upper bound; easy to defend | 1.9× (smaller time step as the fire grows) | Sprinkler failure scenario | Can make an otherwise sound design look impossible |
| CAP (freeze at activation) | Common in guidance and practice; reproduces the intended curve within 1 % | 1.0× | Smoke control design in sprinklered buildings | Depends on the activation time (Bittern: +10 % mean); no spray cooling |
| CAPWET (freeze + spray) | Same HRR as CAP plus spray cooling, steam and smoke drag-down | 1.34× | Smoke near the sprinklers, visibility under the spray, interaction with ventilation | Each step costs 1.4–1.8× more; needs &SPEC ID='WATER VAPOR' |
| DECAY (k = 0.0023 s⁻¹) | Bounding curve for light-hazard office fuels only | 0.71× (cheapest) | Offices and similar fuels, not heavily shielded | Not validated for cars, storage or shielded fuels; the common value 0.023 is a factor-10 typo |
ECOEF (E_COEFFICIENT) |
Physics-based, but needs a measured coefficient; overpredicts heads ×3–5 on UL P-4/P-5 | 1.07× | Research, comparing water densities or nozzle layouts | Puts out unshielded HRRPUA fires in seconds; we know of no coefficient published for cars |
Our recommendation:
- CAP is the default for design. Add an activation-time sensitivity run (±20 %).
- Add the spray (CAPWET) only when the question is about smoke near the sprinklers.
- Keep DECAY for fuels close to the office furnishings it was derived from.
- Use
E_COEFFICIENTfor research and comparisons, not for a design fire.
Pitfalls we hit (and fixed) in FDS 6.11.1
- A far ramp point makes a staircase. FDS interpolates a
RAMPfrom a table of 5000 points between its first and lastT. AddingT=1E5, F=1“to hold the peak” spreads the 5000 points over 100 000 s, so the HRR moves in 20 s steps. Drop that point: FDS holds the last value after the end of the ramp.- The _hrr.csv is an average. It is averaged over
DT_HRR. For the HRR the solver applied at each step, add aDEVC QUANTITY='HRR'withTEMPORAL_STATISTIC='INSTANT VALUE'.- The decay constant is 0.0023 s⁻¹, not 0.023. NISTIR 4833 gives 0.0023 s⁻¹. 0.023 s⁻¹ would halve the fire every 30 s.
- Water drops need
&SPEC ID='WATER VAPOR'. Without it the run stops at the start.- Write devices and obstacles on the grid. Use whole cells (e.g. the car at 12.8–14.7 m, not 12.85), and
QUANTITY='MPUA'for water on a surface.
Run times, cost and scalability on cloudHPC

All the runs used FDS 6.11.1 on hypercore spot instances (preemptible, physical cores), with DT_RESTART so a preemption would only cost a restart.
- Water spray: +34 % wall time. That is CAPWET against CAP: 6.2 h against 4.6 h. The time per step after activation goes from 0.33 s to 0.40 s, and the drops reduce the time step (54 k steps instead of 48 k).
- The cheapest model is the decay (€6.01), because a shrinking fire lets the time step grow.
- FREE is the most expensive (€15.38, 82 k steps), because a 5 MW plume forces small time steps.

For scaling we ran the same model for 90 s (with a faster ramp so the heads open) on 8, 16, 32, 48 and 96 meshes. Each mesh is one MPI process on one physical core.
- Speed-up from 8 to 96 meshes is 11.0× without water and 11.4× with the spray, measured on total solver time. That is 92–95 % of ideal. Measured on time per step after activation only, it is 11.1× and 10.4×.
- The spray costs 1.4–1.8× per step at every size, with 8–10 heads open by 90 s.
- Spot machines vary. We ran the 16-mesh FREE case twice: 2796 s and 1805 s of solver time, a 55 % spread between two machines of the same type. The chart uses the faster run, which lands above the ideal line. Every speed-up is also measured against a single 8-mesh run, so read them as ±10–20 %, not to the decimal.
- Cheapest per test run: 8–16 meshes, €1.17–1.39. Fastest: 96 meshes, 6.5–7 min of solver time for €2.63–2.97, where billing includes boot and upload.
| Group | Runs | Instances | Cost |
|---|---|---|---|
| Car park production | 5 × 1200 s | 16 vCPU hypercore spot | €49.85 |
| Scaling series | 11 × 90 s (one 16-mesh run repeated) | 8–96 vCPU hypercore spot | €19.62 |
| Bittern | 21 tests | 2 vCPU (one run on 8) | €16.19 |
| UL/NFPRF | P-4, P-4 E=0, P-5 (~300 s each) | 16 vCPU hypercore spot | €60.22 |
| Sizing runs | 3 | 16 vCPU hypercore spot | €7.54 |
| Total | 43 runs | €153.42 |
The UL tests are the expensive part: about 100–160 s of wall time per simulated second on 16 cores, because of the 2.4 M cells and thousands of drops from up to 58 heads.
How to run these cases on cloudHPC
- Upload the folder. Download the cases ZIP, unzip it and upload one case folder (e.g.
carpark/prod/CAP) to your cloudHPC storage. - Pick the solver and instance. Choose solver fds6.11.1 and hypercore with vCPU = number of
&MESHlines (16 for the car park inputs). Spot is fine: the car park and UL inputs haveDT_RESTART=300. - Expand any
MULT. One&MESHwithMULT_IDcounts as one MPI process. Ourexpand.pywrites explicit&MESHlines. - Split large single meshes yourself, without
MB=. cloudHPC splits a single mesh automatically, unless the input has a&VENT MB=…. WithMB=, the run used 1 MPI process and threads: Bittern test 1 cost €3.76, against a median of €0.64 for the split tests. Oursplit.pyreplacesMB=withXB=. - Read the results.
logs.tar.gzin the case folder has all the CSV files. CheckSTOP: FDS completed successfullyin the.outfile.
Storage on cloudHPC is deleted automatically after 60 days: download what you want to keep.
FAQ
How do I stop the HRR from growing after a sprinkler activates in FDS? Use the DEVC_ID of a TIME device on the first line of the RAMP, and freeze that device with NO_UPDATE_CTRL_ID pointing to a CTRL that becomes true when the first sprinkler opens. The CAP snippet above is complete.
What decay constant should I use after sprinkler activation? Madrzykowski & Vettori (NISTIR 4833, 1992) give an HRR reduction factor e^(−0.0023 t), with t in seconds after activation. It is an upper bound for light-hazard office furnishings that are not heavily shielded, at a spray density of at least 0.07 mm/s. The value 0.023 that circulates online is ten times too fast.
Can I use E_COEFFICIENT for a car fire? Not as a design method. We know of no published coefficient for vehicles. With HRRPUA on an open top face, the spray reaches the fuel directly and FDS cut our car fire by over 90 % in 30 s and put it out in about a minute. On the UL rack tests, the validated case, FDS opens 3–5 times too many heads.
How accurate is FDS for sprinkler activation time? On the 21 Bittern room tests, FDS 6.11.1 predicted 38 of 41 activations, with a mean error of +10.5 % and 33 of the 38 within ±20 %. It tends to be late: 31 of the 38 predicted, and all 3 missed. The error was largest for test 16 (+63/+76 %).
Does adding water particles make FDS much slower? On the 1.34 M-cell car park, the spray from two heads made the 1200 s run 34 % longer. In scaling runs where more heads open, it cost 1.4–1.8× per step. In large warehouse tests with dozens of heads, drops dominate the cost: about 100–160 s of wall time per simulated second on 16 cores.
References
- McGrattan K. et al., Fire Dynamics Simulator User’s Guide, NIST Special Publication 1019, 6th edition, FDS 6.11.1. https://pages.nist.gov/fds-smv/
- McGrattan K. et al., Fire Dynamics Simulator Technical Reference Guide, Volume 3: Validation, NIST SP 1018-3. https://pages.nist.gov/fds-smv/
- Madrzykowski D., Vettori R.L., A Sprinkler Fire Suppression Algorithm for the GSA Engineering Fire Assessment System, NISTIR 4833, 1992. https://doi.org/10.6028/NIST.IR.4833
- Madrzykowski D., Vettori R.L., Sprinkler Fire Suppression Algorithm, Journal of Fire Protection Engineering 4(4), 151–164, 1992.
- Bittern A., Analysis of FDS Predicted Sprinkler Activation Times with Experiments, Fire Engineering Research Report 04/8, University of Canterbury, 2004. https://ir.canterbury.ac.nz/handle/10092/14748
- Hopkin C., Spearpoint M., Bittern A., Using Experimental Sprinkler Actuation Times to Assess the Performance of FDS, Journal of Fire Sciences 36(4), 342–361, 2018.
- Wade C., Spearpoint M., Bittern A., Tsai K., Assessing the Sprinkler Activation Predictive Capability of the BRANZFIRE Fire Model, Fire Technology 43(3), 175–193, 2007. https://doi.org/10.1007/s10694-007-0009-5
- McGrattan K.B., Hamins A., Stroup D., Sprinkler, Smoke & Heat Vent, Draft Curtain Interaction – Large Scale Experiments and Model Development, NISTIR 6196-1, 1998. https://doi.org/10.6028/NIST.IR.6196-1
- Tohir M.Z.M., Spearpoint M., Distribution analysis of the fire severity characteristics of single passenger road vehicles using heat release rate data, Fire Science Reviews 2:5, 2013. https://doi.org/10.1186/2193-0414-2-5
- Joyeux D., Natural fires in closed car parks – Car fire tests, CTICM, 1997 (curve C2 as collected in ref. 9).
- FDS validation inputs and experimental data: https://github.com/firemodels/fds (tag FDS-6.11.1), https://github.com/firemodels/exp ; NIST model results: https://github.com/firemodels/out
CloudHPC is a HPC provider to run engineering simulations on the cloud. CloudHPC provides from 1 to 224 vCPUs for each process in several configuration of HPC infrastructure - both multi-thread and multi-core. Current software ranges includes several CAE, CFD, FEA, FEM software among which OpenFOAM, FDS, Blender and several others.
New users benefit of a FREE trial of 300 vCPU/Hours to be used on the platform in order to test the platform, all each features and verify if it is suitable for their needs