Steckler room fire: FDS vs OpenFOAM with a heat-source fire and passive soot
The Steckler room fire is one of the classic validation cases for fire models: a methane burner in a small room with an open door. It’s in the official FDS validation guide, and the measured door velocities and temperatures are public in the firemodels repositories.
We used it to answer a question many fire engineers ask: how far can you go in OpenFOAM with a simple fire model, a volumetric heat source plus a passive soot scalar, compared with FDS burning the fuel? We were especially interested in soot density and visibility, the quantities that matter in smoke control design.
1. The case
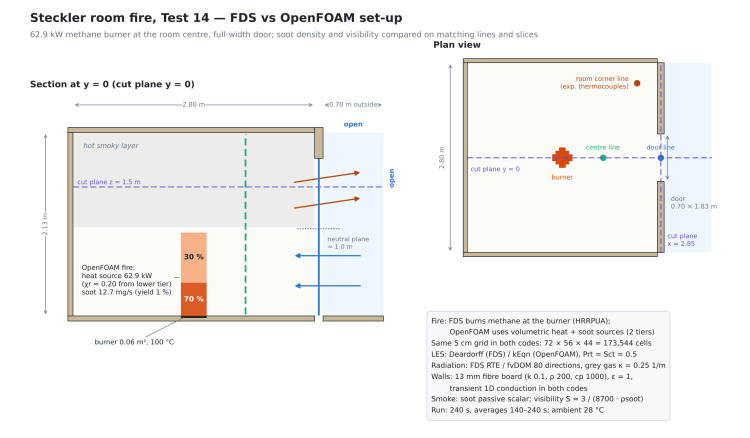
We used Test 14 of Steckler, Quintiere and Rinkinen (1982):
- Room 2.8 m × 2.8 m with 13 mm fibre-board walls
- Full-width door, 0.74 m wide in the experiment, 0.70 m × 1.83 m on the 5 cm grid (as in the FDS input)
- Methane burner at the centre of the room, 62.9 kW
- 240 s of simulated time; all results are averages over 140–240 s
Both codes ran on the same 5 cm grid, 173,544 cells, with a region outside the door and open boundaries.
| FDS | OpenFOAM 14 | |
|---|---|---|
| Solver | FDS, LES | foamRun -solver fluid (the Foundation equivalent of buoyantPimpleFoam), LES |
| Turbulence | Deardorff | kEqn |
| Fire | Methane combustion at the burner | Volumetric heat source, 62.9 kW, 20% emitted as radiation |
| Smoke | Soot from the combustion model, 1% yield | Passive soot scalar, same 1% yield |
| Radiation | FDS radiation solver | fvDOM, 80 directions, grey gas κ = 0.25 1/m taken from FDS |
| Walls | Fibre board, 1D transient conduction | Run 2: steady conduction. Run 3: 1D transient conduction |
| Output | SLCF slices and DEVC lines | cutPlanes at the same positions and lines at the measurement points |
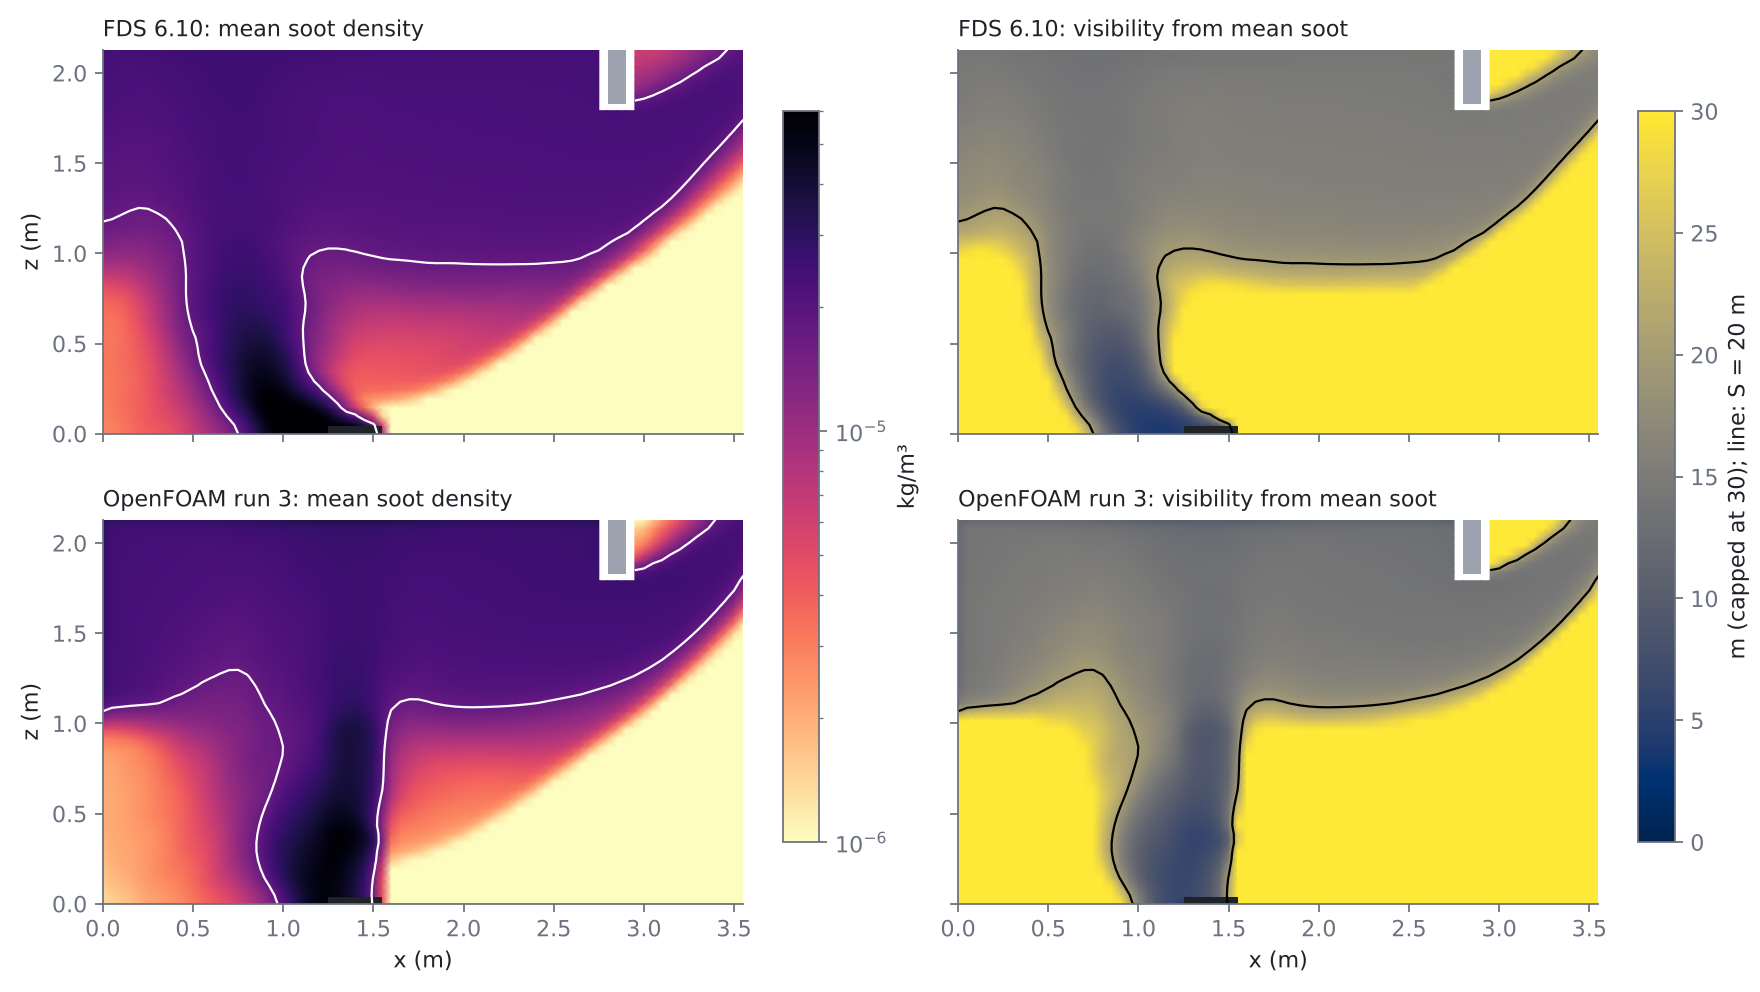
Visibility is computed in both codes from the mean soot density with the usual formula S = 3 / (Km · ρsoot), with Km = 8700 m²/kg, capped at 30 m.
Steckler’s experiment measured velocity and temperature, but not smoke. So velocity and temperature are compared with the experiment, while soot and visibility are a comparison between the two codes.
2. Getting OpenFOAM stable: the floor under the fire
The first OpenFOAM tests crashed within the first second, always at the step where radiation was updated. Two short diagnostic runs (without radiation, and with radiation plus a modified floor) found the cause.
The fire zone radiates 12.6 kW and sits on the floor. With the floor modelled as insulated fibre board, the 0.06 m² under the flame received tens of kW/m² with almost nowhere to send it. The wall temperature computed by the boundary condition became absurd, and the energy equation went out of range.
The fix was to do what FDS does: in FDS the burner surface is held at 100 °C. Giving the burner footprint its own patch at a fixed 373 K stabilised the run. It’s also the physically correct set-up, not a workaround.
3. Two OpenFOAM runs
- Run 2: heat source spread evenly over a 0.97 m column above the burner (the mean flame height from Heskestad’s correlation), walls with steady-state conduction.
- Run 3: 70% of the heat released in the lowest 0.39 m (the continuous-flame region from McCaffrey’s correlation) and 30% above, plus a new wall boundary condition with transient 1D conduction through the board, like the FDS wall model. Run 3 also reports thermocouple-corrected temperatures, as FDS does.
4. Results
| Experiment | FDS | OpenFOAM run 2 | OpenFOAM run 3 | |
|---|---|---|---|---|
| Neutral plane (m) | 1.01 | 0.98 | 1.005 | 1.025 |
| Door temperature at 1.77 m (°C) | 128.6 | 132.1 | 157.6 (gas) | 130.7 |
| Room temperature at 1.8 m (°C) | 129.5 | 134.9 | 160.7 (gas) | 131.2 |
| Room temperature at 0.97 m (°C) | 95 | 114 | 67 | 69 |
| Door velocity at 1.77 m (m/s) | 2.15 | 1.96 | 1.64 | 1.51 |
| Door velocity at 0.06 m (m/s) | −0.82 | −0.89 | −0.62 | −0.58 |
| Outflow through the door (kg/s) | – | 0.486 | 0.416 | 0.424 |
| Soot, room corner at 1.8 m (mg/m³) | – | 24.4 | 29.8 | 27.3 |
| Soot, room corner at 0.9 m (mg/m³) | – | 17.7 | 4.0 | 7.5 |
| Visibility, room corner at 1.8 m (m) | – | 14.1 | 11.6 | 12.6 |
Temperatures: the walls fixed the hot layer
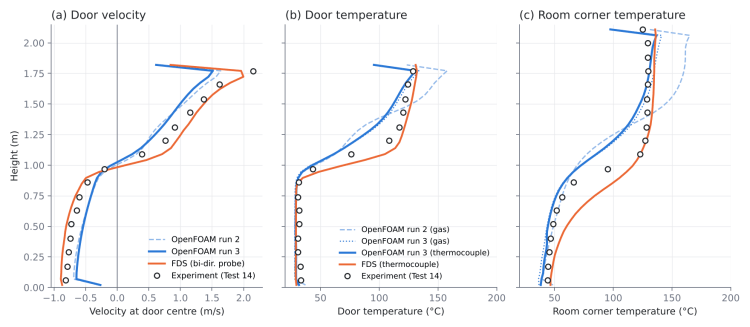
- In run 2 the hot layer was 25–30 °C too hot (gas temperature). The board takes about 340 s to heat through, so between 140 and 240 s the walls are still absorbing heat, and the steady-state wall underestimated it.
- With transient conduction, run 3 is within about 2 °C of the measurements in the upper layer, slightly closer than FDS. The wall losses (about 14–15 kW) are now in line with FDS.
- The thermocouple correction changes the result by only 3–4 °C: the wall model did the work.
- Below 0.75 m OpenFOAM follows the experiment better than FDS, which is too warm there. The weak spot is the interface around 1 m, where OpenFOAM’s transition is too sharp (69 °C against 95 °C measured).
Soot density and visibility


- In the upper layer run 3 has 27 mg/m³ of soot against 24 in FDS, so visibility is 12.6 m against 14.1 m.
- The bigger difference is the height of the smoke layer: OpenFOAM puts the interface about 0.2 m higher than FDS, with a sharper transition. At 0.9 m in the room corner FDS has 17.7 mg/m³, OpenFOAM 7.5.
- For a smoke control design this is the number that matters: where visibility drops below the design threshold. Here the passive-scalar approach gives a less conservative answer near 1 m.
- As a check of our post-processing, FDS’s own VISIBILITY output, time-averaged, matches the curve computed from its mean soot density.
Why: the shape of the plume

The slices show the main difference. In FDS the air coming in through the door bends the plume towards the back wall right from the burner. In OpenFOAM the plume tilts only slightly. Heat released in fixed cells above the burner keeps the lower plume vertical, so it entrains less air: the door flows are about 13% lower than in FDS and the smoke layer interface stays sharper.
Redistributing the heat (70/30 in run 3) improved the soot below the interface but didn’t fix the flows. The next variable to change is how the fire itself is represented.
5. Run time and cost
| Run | Hardware | Wall time | Cost |
|---|---|---|---|
| FDS | 16 vCPU | ~70 min | €0.72 |
| OpenFOAM 14, run 2 | 16 vCPU highcore | 4.6 h | €3.72 |
| OpenFOAM 14, run 3 | 16 vCPU hypercore | 3.4 h | €5.95 |
Costs are the actual amounts billed by cloudHPC. On the same grid, FDS was 3–4 times faster and 5–8 times cheaper. Most of the OpenFOAM cost comes from the outer iterations per time step (5–7 once the flow settles), which we used to keep the first, stiff seconds of the fire stable.
6. Takeaways
- A heat source plus a passive soot scalar gets the hot layer right in OpenFOAM, within a couple of degrees of the experiment, once the walls are modelled with transient conduction.
- The walls matter as much as the fire. A steady-state wall made the hot layer 25–30 °C too hot.
- The burner surface needs its own boundary condition, at 100 °C as in FDS. Without it the radiation coupling with an insulated floor made the run unstable.
- The fire model drives the smoke-layer height. A fixed heat-release zone keeps the plume vertical, so entrainment, door flows and the soot below the interface are underestimated. For visibility near head height this is not conservative.
- FDS remains the faster and cheaper tool for this kind of case, and closer to the experiment on the door flows.
Next, we’ll compare a different way of modelling the fire source in OpenFOAM on the same mesh, walls and outputs.
All case files are available on request.
References
- K. D. Steckler, J. G. Quintiere, W. J. Rinkinen (1982). Flow induced by fire in a compartment. NBSIR 82-2520, National Bureau of Standards.
- K. McGrattan et al. Fire Dynamics Simulator Technical Reference Guide, Volume 3: Validation. NIST Special Publication 1018-3. Data: github.com/firemodels/exp
- G. Heskestad (1983). Luminous heights of turbulent diffusion flames. Fire Safety Journal 5, 103–108.
- B. J. McCaffrey (1979). Purely buoyant diffusion flames: some experimental results. NBSIR 79-1910.
- OpenFOAM Foundation, openfoam.org; FDS, pages.nist.gov/fds-smv
CloudHPC is a HPC provider to run engineering simulations on the cloud. CloudHPC provides from 1 to 224 vCPUs for each process in several configuration of HPC infrastructure - both multi-thread and multi-core. Current software ranges includes several CAE, CFD, FEA, FEM software among which OpenFOAM, FDS, Blender and several others.
New users benefit of a FREE trial of 300 vCPU/Hours to be used on the platform in order to test the platform, all each features and verify if it is suitable for their needs

