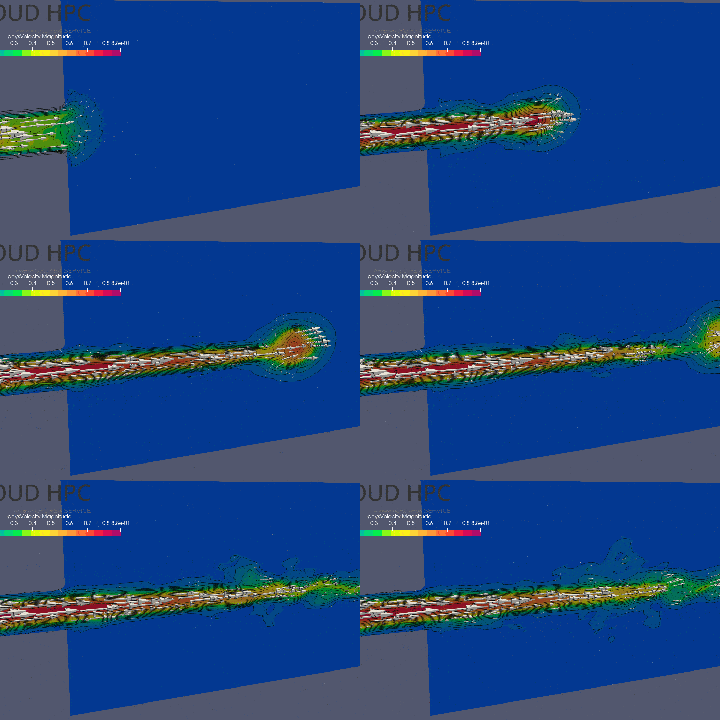
Unleash the Power of Visualization: Getting Started with pvpython for VTK Data
Have you ever worked with large, complex datasets and felt overwhelmed trying to understand them? Visualization is often the key to unlocking hidden insights, and the power of ParaView is now accessible through its Python scripting interface, pvpython. This blog post will guide you through the basics of using pvpython to load VTK files, visualize data, extract specific sections, and save your findings. Let’s dive in!
What is pvpython?
pvpython is the scripting engine behind the popular open-source visualization application, ParaView. It allows you to automate complex visualization tasks, build sophisticated pipelines, and integrate visualization directly into your workflows. It’s a fantastic tool for researchers, engineers, and anyone who needs to explore and understand their data in a powerful way.
Our Scenario: Visualizing a VTK Dataset
We’ll assume you have a VTK file (e.g., a my_data.vtk file) containing geometric data and associated variables. This is often the output of simulations or data acquisition. Our goal is to:
- Open the VTK file.
- Color the geometry based on a specific variable.
- Extract a slice for a cross-sectional view.
- Save the visualization as an image or animation.
Let’s Get Scripting!
Here’s a step-by-step guide with the corresponding pvpython script and explanations:
# Import necessary modules from ParaView
from paraview.simple import *

# 1. Load the VTK Data
data_path = "my_data.vtk"  # Replace with your VTK file path
reader = OpenDataFile(data_path)

# 2. Create a RenderView
render_view = CreateRenderView()
render_view.InteractionMode = '3D' # Set the rendering mode (2D or 3D)
render_view.CameraPosition = [0, 0, 1] # Set the initial camera position
render_view.CameraViewUp = [0, 1, 0]  # Set the initial camera view up direction
render_view.CameraFocalPoint = [0,0,0] # Set the focal point of the camera

# 3. Color the Data by a Variable
display = Show(reader, render_view)

# Change 'my_variable' to the actual name of your variable
display.ColorArrayName = ['POINTS', 'my_variable']
display.SetScalarBarVisibility(render_view, True)  # Show the color bar
display.LookupTable.ScalarRange = [0, 1] # Set scalar range

# 4. Extract a Slice
slice = Slice(Input=reader)
slice.SliceType = 'Plane'
slice.SliceType.Origin = [0, 0, 0] # Set slice origin
slice.SliceType.Normal = [1, 0, 0]  # Set slice normal
slice_display = Show(slice, render_view)
slice_display.ColorArrayName = ['POINTS', 'my_variable'] # Set scalar array for slice
slice_display.SetScalarBarVisibility(render_view, False)  # Hide the slice color bar (optional)

# 5. Adjust camera view (optional)
render_view.ResetCamera()

# 6. Save the Visualization (Image)
SaveScreenshot("visualization.png", render_view, magnification=3)

# 7. Save a Movie (optional)
# Uncomment the code below if you would like to save a movie.
# render_view.ViewSize = [1024, 768]
# animation_scene = GetAnimationScene()
# animation_scene.NumberOfFrames = 30
# animation_scene.PlayMode = 'Sequence'
# for i in range(30):
#    # Adjust slice normal
#    slice.SliceType.Normal = [i/29, 0, 1 - i/29]
#    Render()
#    SaveScreenshot("movie/frame_{0:03d}.png".format(i), render_view)
#
# # You'll need an external tool like ffmpeg to convert the individual images into a movie
Explanation:
- Import Modules: We import necessary functions from the
paraview.simplemodule. - Load VTK File:
OpenDataFile()loads your VTK data. Replace"my_data.vtk"with your file path. - Create RenderView: A
RenderViewis your canvas for visualization. - Display and Color:
Show(reader, render_view)makes the geometry visible.display.ColorArrayNameselects the variable to use for coloring. Change'my_variable'to the name of the variable you want to visualize.display.SetScalarBarVisibility()shows a color bar to explain the color mapping.display.LookupTable.ScalarRangesets the minimum and maximum values for color mapping.
- Extract a Slice:
- The
Slice()function creates a plane intersecting the geometry. - You can adjust the
OriginandNormalto define the slice’s position and orientation.
- The
- Adjust Camera view: The view can be adjusted via
render_view.ResetCamera(),render_view.CameraPosition,render_view.CameraViewUp, andrender_view.CameraFocalPoint. - Save Screenshot:
SaveScreenshot()will save a static image of your visualization. - Save Animation (optional):
- We set the view size with
render_view.ViewSize. - The animation scene is controlled by
GetAnimationScene(). - To save an animation the program will loop and save a number of screenshots.
- You need an external tool such as
ffmpegto stitch these together into a video.
How to Run This Script
- Save: Copy and paste the code into a text editor and save it as
my_visualization.py(or any name with a.pyextension). - Open Terminal: Open a terminal or command prompt.
- Run
pvpython: Execute the script using the following command:pvpython my_visualization.pyThis will run the script, create avisualization.png(or a folder calledmoviewith frames and then a movie usingffmpeg) in the same directory.
Key Takeaways
pvpythonis a powerful tool for scripting complex visualizations.- You can load VTK data, apply color mappings, extract slices, and save results easily.
- Experiment with different variable names, slice orientations, and save options to explore your data.
- This blog post gives you a solid foundation for more advanced visualization techniques.
- Remember to change the VTK file name, variable name, slice parameters, and save path in the script to suit your specific needs.
Next Steps
- Explore the ParaView documentation for advanced features and filters.
- Practice with your own data and try different visualizations.
- Investigate the
paraview.simplemodule for more advanced features and functionalities.
Visualization is an integral part of data analysis, and by using pvpython, you can create compelling and informative visualizations with ease. Happy visualizing!
CloudHPC is a HPC provider to run engineering simulations on the cloud. CloudHPC provides from 1 to 224 vCPUs for each process in several configuration of HPC infrastructure - both multi-thread and multi-core. Current software ranges includes several CAE, CFD, FEA, FEM software among which OpenFOAM, FDS, Blender and several others.
New users benefit of a FREE trial of 300 vCPU/Hours to be used on the platform in order to test the platform, all each features and verify if it is suitable for their needs


